
Setting the example? Income inequality in the US is at an all-time high
Published 27 Sep, 2019 10:50 | Updated 28 Sep, 2019 09:58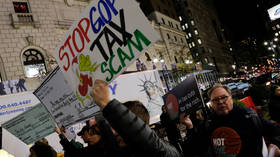
Last year the income gap between richest and poorest people in the US stood at its highest level since 1967, the first year the Census Bureau started tracking it. DC and New York are among places where the differences are worst.
The US may be the world’s wealthiest nation, but it is also one where the super-rich thrive no matter what while the desperately poor often rely on GoFundMe to pay their medical bills. The economic inequality affects both wealth and incomes, with the latter being at an all-time high.
Also on rt.com 'Deaths of despair' soaring among Gen Z & millennials: 'It's the economy, stupid'One way to measure income inequality is the Gini index. It measures between 0, a score for absolute equality and 1, which stands for a hypothetical situation in which a single household gets all income in a nation. The Census Bureau has been tracking the index for over 50 years. In 1967 it stood at 0.397 but, in 2018, it rose to 0.485, the highest figure on the record.
There are nations with worse income inequalities, including some with reasonably strong economies. For example, the World Bank estimates that South Africa’s Gini index stood at 0.63 in 2014 while Brazil’s was 0.53 in 2017. By comparison, all EU countries have a Gini index below 0.4.
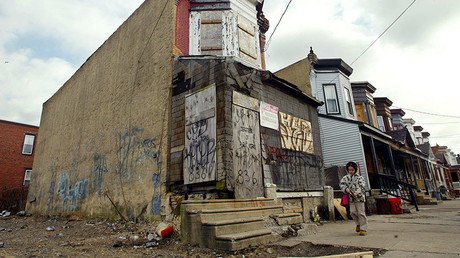
The new data shows that income inequality is most acute in places where wealth is concentrated, including DC, New York and Connecticut, as well as in poverty-ridden areas like Puerto Rico and Louisiana. Utah, Alaska, Iowa, North Dakota and South Dakota had the most economic equality.
The census also showed a stagnating growth of median household income, which grew to over $62,000. It’s the highest level ever measured by the American Community Survey, but the increase was just 0.8 from 2017 to 2018, much smaller compared to increases in the previous three years and amounting to virtually no growth at all if adjusted to inflation.
The new statistics will likely put some wind into the sails of progressive Democratic contenders for the party nomination for next year’s presidential election, who call for leaning on the super-wealthy individuals and on big corporations to pay more taxes.
Also on rt.com Trickle-down economics doesn’t work, as protest movements worldwide show – Keiser ReportIt may also undermine the rationale behind the current administration’s corporate tax breaks, which were passed through Congress in 2017. The goal was to convince multinationals to bring back manufacturing jobs as money trickles down to the middle and poor classes. In practice, it seems, it led to extra bonuses for executives and the rest of the country largely missing out on the benefits a growing economy and record low unemployment. Well, someone needs to pay for all those private jet trips.
Think your friends would be interested? Share this story!