US Hispanics rank Donald Trump last as presidential candidate – poll
Published 25 Feb, 2016 20:20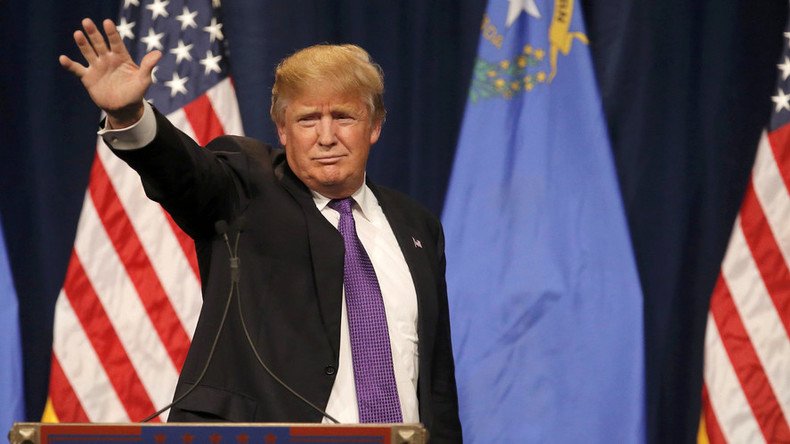
Donald Trump’s views have earned him the highest negative ratings among the US Hispanic population, a new poll by Washington Post-Univision News has shown.
The Hispanic community’s negative perception of Trump has grown over the past seven months since he called for building a wall between the US and Mexico, while advocating the deportation of all undocumented migrants illegally living in the US.

Currently, 8 in 10 Hispanics would vote against the Republican candidate, 7 of which have a “very unfavorable” view of Trump, which is twice the number of negative votes promised for any of the other presidential candidates.
On the other hand, 6 in 10 Hispanics don’t believe that Trump’s views on immigration represent the Republican Party.
So would they support another Republican candidate? Very likely, the poll demonstrates.
In a matchup with Clinton, 88 percent of Republican-leaning Hispanics said they would vote for Rubio and 80 percent – for Cruz.
However, only 59 percent would support Trump against the Democratic candidate.
All in all, Hispanics favor the Democratic Party over the Republicans, but the survey suggested that, on the whole, the majority aren’t very satisfied with the present Democratic leadership or Obama’s presidency – just 23 percent of Hispanic voters say they believe Democratic leaders “very much,” while 42 percent trust them only “somewhat.”
By a margin of about 3 to 1, Hispanic voters favor Democrats over Republicans to deal with immigration, health care, and gay marriage.
Hispanics show the least amount of faith in Democrats when it comes to coping with terrorism – 38 percent trust Democrats, 33 percent trust Republicans, and the rest choose both or neither.