Income inequality increasing in major US cities
Published 18 Mar, 2015 23:32 | Updated 18 Mar, 2015 23:31
The wealth disparity grew both for major metropolises and the country as a whole between 2012 and 2013. But some of the nation’s largest cities have more income inequality among their residents than the United States does overall, a new report has found.
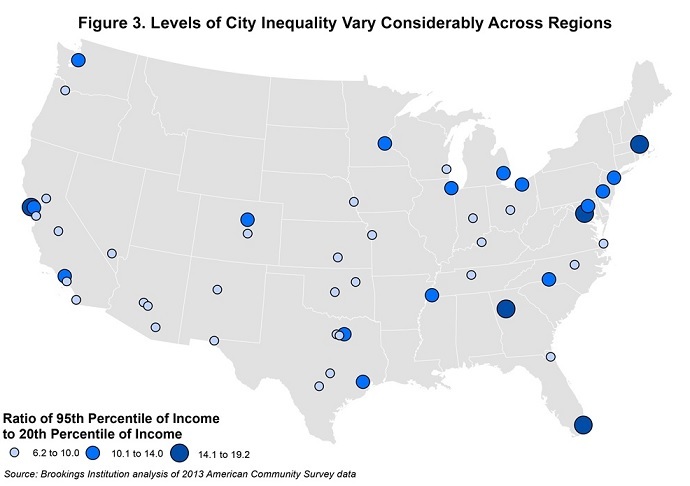
Across the 50 largest cities, households in the 95th percentile of income (or the top 5 percent of households) earned 11.6 times as much as households as the 20th percentile (or bottom 20 percent of households) – a considerably wider margin than the national average ratio of 9.3, according to Alan Berube, a senior fellow and deputy director of the Brookings Metropolitan Policy Program, and Natalie Holmes, a senior research assistant at the Metropolitan Policy Program.
“This difference reflects the fact that in big cities the rich have higher incomes, and the poor lower incomes, than their counterparts nationally,” they wrote.
In their report, the two researchers updated a previous analysis of the urban areas, focusing on trends between 2012 and 2013 ‒ the last year for which US Census Bureau data is available. The previous study covered 2007 to 2012. They looked at the incomes among households near the top of the distribution ‒ those earning more than 95 percent of all other households ‒ and households closer to the bottom of the distribution ‒ those earning more than only 20 percent of all other households. Then they compared the two, finding what they called the “95/20 ratio.”
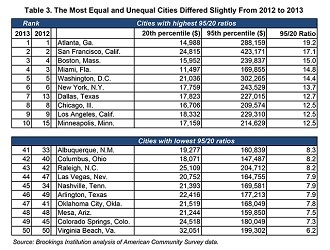
Berube and Holmes discovered that Atlanta, Georgia was the most unequal big city, with top household incomes in the city nearly 20 times those near the bottom. That designation remained unchanged from their previous analysis. San Francisco still ranked second, with a 95/20 ratio of roughly 17. Boston moved up to third place at 15, while Miami dropped to fourth place thanks to modest income growth among its poorer households, they wrote.
The cities with the most equal distribution of incomes also remained largely the same from 2012 to 2013, with Virginia Beach, Virginia topping the list, followed by Colorado Springs, Colorado and Mesa, Arizona.
The majority of the areas with the lowest 95/20 Ratio are “geographically large cities that incorporate large swaths of suburban territory within their borders, and most are in the South and West,” the analysts wrote. “In addition, these cities are not home to the concentrations of technology and financial/professional services industries that pay the very highest salaries and that characterize many of the cities at the top of the inequality rankings.”
Among the country’s big cities, Seattle, Washington had the largest increase in income growth for its wealthy residents, with a 14.9 percent growth in income among the 95th percentile households, equivalent to a $36,000 increase.
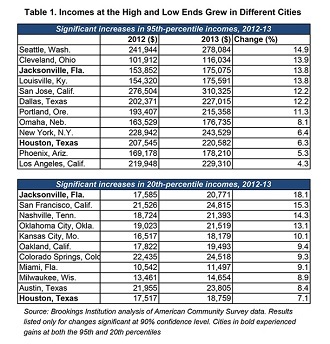
Jacksonville, Florida ‒ which the researchers note is “not generally regarded as wealthy” ‒ came in third with a 13.8 percent increase that translated to only a $21,000 income increase for the members of the 95th percentile. However, the northern Florida metropolis had the highest income increase for households in the 20th percentile, at 18.1 percent ‒ a $3,000 increase.
“These findings confirm that income inequality remains a salient issue in many big cities today. Moreover, they lend support to the concern that rising incomes at the top of the distribution are not ‒ at least in the short term ‒ lifting earnings near the bottom, even in local markets,” Berube and Holmes wrote in their conlcusion.
The Metropolitan Policy Program’s deputy director expanded on the findings to the Washington Post’s Emily Badger
“There is a seeming disconnect between what goes on at the top, and what goes on at the bottom,” Berube said. “At the city level, we’re not always seeing much of a relationship between the two. That suggests that market forces alone are not going to help close this gap. If you’re concerned about it, you need to be intentional about it.”
In the report, he cited actions by states and cities that have or are moving to increase their minimum wages as ways to decrease the 95/20 Ratio. But he and Holmes noted that local politicians shouldn’t ignore other tools, like education, economic development and housing and zoning policies.