Interactive documentary’s data visualization brings staggering WWII losses to life
Published 7 Jun, 2015 19:36 | Updated 8 Jun, 2015 12:44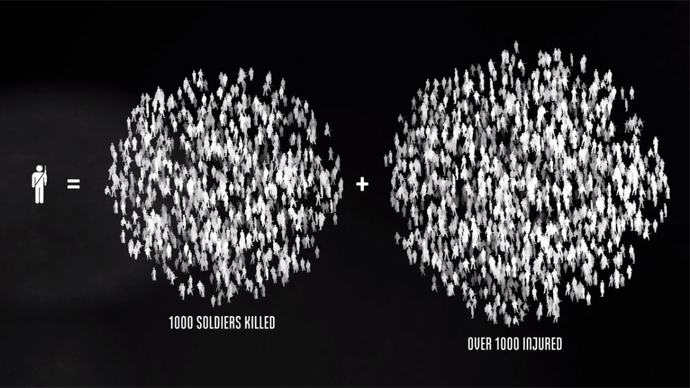
A new interactive documentary, “The Fallen of World War II,” which helps viewers understand the shocking numbers of both military and civilian deaths during the six years of history’s deadliest conflict, has grabbed over a million views online.
Written, coded, directed and narrated by data visualization artist Neil Halloran, the 18-minute film is styled like an infographic and that helps viewers fathom the scale of casualties in a way that simple numbers cannot. The base elements it uses are simple human-shaped icons. Each of those represents one thousand deaths – and at some points in the video they pile up into staggering graphs.
It is also interactive (the interactive version is available at the documentary’s website, fallen.io), allowing the viewer to mouse over different elements in the graphs to see detailed info.
The video is split into three parts. The first one focuses on the 22 million soldiers that died during World War II, dividing them by front, nation and battle. One especially astonishing moment, about 5:30 into the video above, is the casualty count from Stalingrad – where about the same number of Nazi troops died as in all of the battles against the UK, the US and France combined. Soviet losses were even greater than that.
The narrator points out that while the Nazi Germany suffered its biggest losses when fighting the Soviet Union, Joseph Stalin was often willing to sacrifice stunning numbers of soldiers to achieve those victories.
The second part counts civilian deaths. It starts with Nazi death camps and the Holocaust, where some 6 million Jews died, and goes on to list other casualties. Again, the Soviet Union suffered the most losses: over 10 million. It is followed by China, with up to 16 million civilian casualties, and Poland, which lost 5 million people.
READ MORE ‘Third World War being fought piecemeal’: Pope Francis slams global ‘atmosphere of war’
“The intentional killing of civilians was done by most warring parties, including the United Kingdom and the United States,” the documentary narrates. The US nuclear strikes on Japan, contrary to official statements, “were directed at civilian populations, not military targets.” The UK lost some 60 thousand civilians to urban bombings carried out by Germany. It answered in kind, causing about 10 times more deaths in Germany. However, even more German civilians died from the counter-offensive in the late stages of the war, the narrator says.
And the third and final part puts the total World War II deaths, which amount to over 40 million, in perspective, comparing them to other conflicts before and after, both in absolute numbers and as a percentage of world population.
Here it becomes evident that there may have been more devastating wars before, proportionally speaking, like the 13th-14th century Mongol conquests – but none of those killed as many people in such a short span as World War II.
“Sometimes it takes reminding ourselves of how terrible war once was to see the peace that has been growing around us,” the film concludes. “So if watching the news doesn’t make us feel hopeful about where things are heading, watching the numbers might.”
In order to mark the 70th anniversary of the victory over Nazi Germany, RT has created its own infographic to gauge the scale of fighting during the Soviet Union’s stand against the Germans. The “battle heatmap” shows every single major confrontation of the conflict, accompanied with a timeline to help understand the flow of the war.