Latest Google time-lapse charts incredible urban sprawl, environmental cost of past 32 years (VIDEO)
Published 10 Dec, 2016 15:45 | Updated 10 Dec, 2016 15:51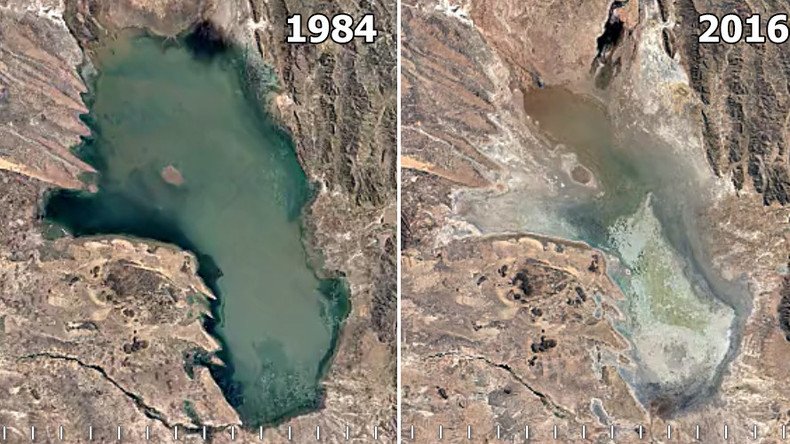
Google’s most detailed satellite timeline to date is providing people with an incredible insight into the world’s runaway urban sprawl, while also offering up a stark reminder of how the planet’s natural landscape has been left scarred by human interference.
The latest Google Earth time-lapse is an update to a version released in 2013 and, according to the search engine, gives a “sharper view of our planet.”
The coastline of #Chatham, MA changes in 150-year cycles. https://t.co/zzHIMvRxAb#PretendToBeATimeTravelerDay#EarthTimelapsepic.twitter.com/qjbfBLG1GG
— Google Maps (@googlemaps) December 8, 2016
Made up of more than five million pictures from five separate satellites, the online tool allows users to search geographical areas like the Antarctic, and witness how they have fared over the last 32 years.
For example, in a matter of seconds, Dubai’s playground for the rich and famous can be seen to sprout from the desert sands, with artificial getaways like Palm Islands popping up in the Persian Gulf.
It could be said that from 1984 to 2016, the Chinese municipality of Chongqing underwent one of the most dramatic of metamorphoses, transforming from a relatively modest urban area to a huge metropolis with a population of more than 30 million people.
The majority of the satellite images come from the Landsat program, a joint initiative started in the 1970s by the United States Geological Survey and NASA to gather pictures of Earth from space.
For 2015 and 2016, Google said they combined Landsat 8 imagery with data from Sentinel-2A, an orbiter managed by the European Space Agency.
The sweeping geographical timeline displays what many might term as 'development.'
However, the harrowing toll of human activity is also apparent through the disappearance of lakes and forests, as well as the expansion of fossil fuel sites and mineral extraction.
Poopó Lake drought, Bolivia
Amazon Rainforest, Mato Grosso, Brazil
Coal mining, Wyoming, USA
Aral Sea disappearance, Kazakhstan
Desertification, Kenya and Tanzania
Orapa and Jwaneng diamond mines, Botswana
Athabasca oil sands, Alberta, Canada