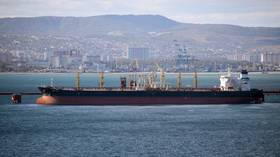
Iran ramps up oil output as OPEC production falls
Published 14 Apr, 2017 14:47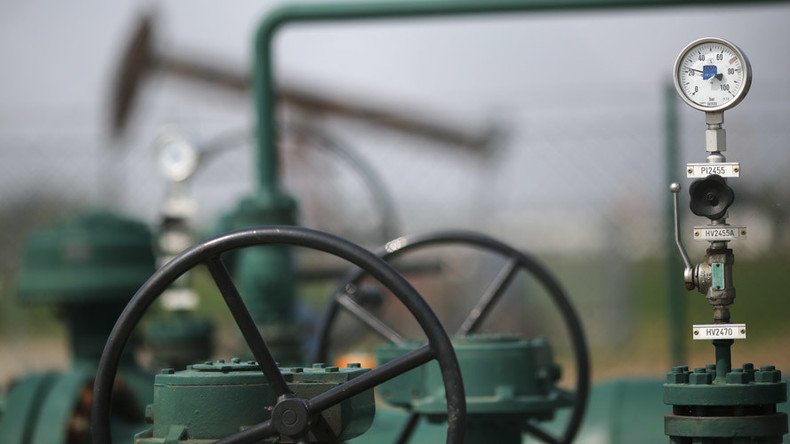
The OPEC Monthly Oil Market Report is out with OPEC’s crude oil production numbers for March 2017.
All data is through March 2017 and is in thousand barrels per day (bpd).
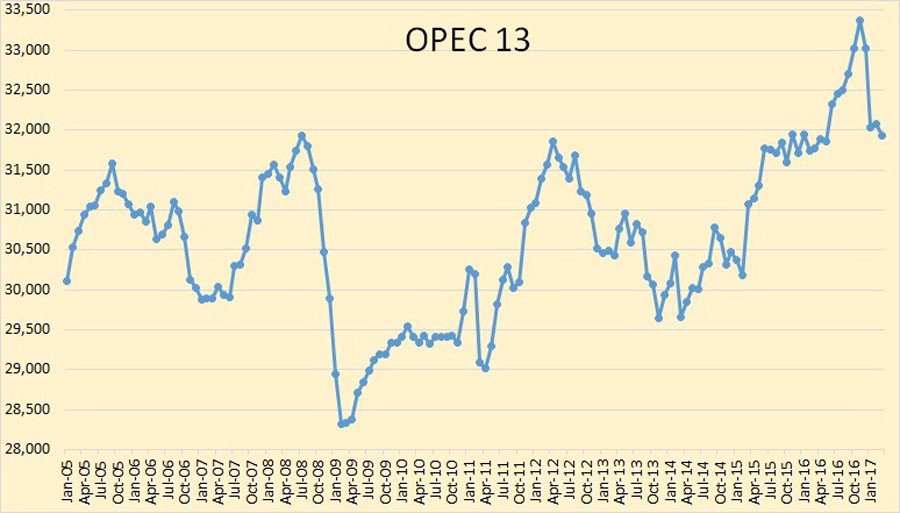
Looking at the above chart it seems obvious what most OPEC nations were doing. They announced in the summer of 2016 that there would likely be quota cuts beginning in 2017. And those cuts would be a percentage of their current production. So everyone began making heroic attempts to increase production by the end of 2016. Now, after everyone who felt that they should cut, has cut, they are right back to the level that they were at before the cuts were proposed.
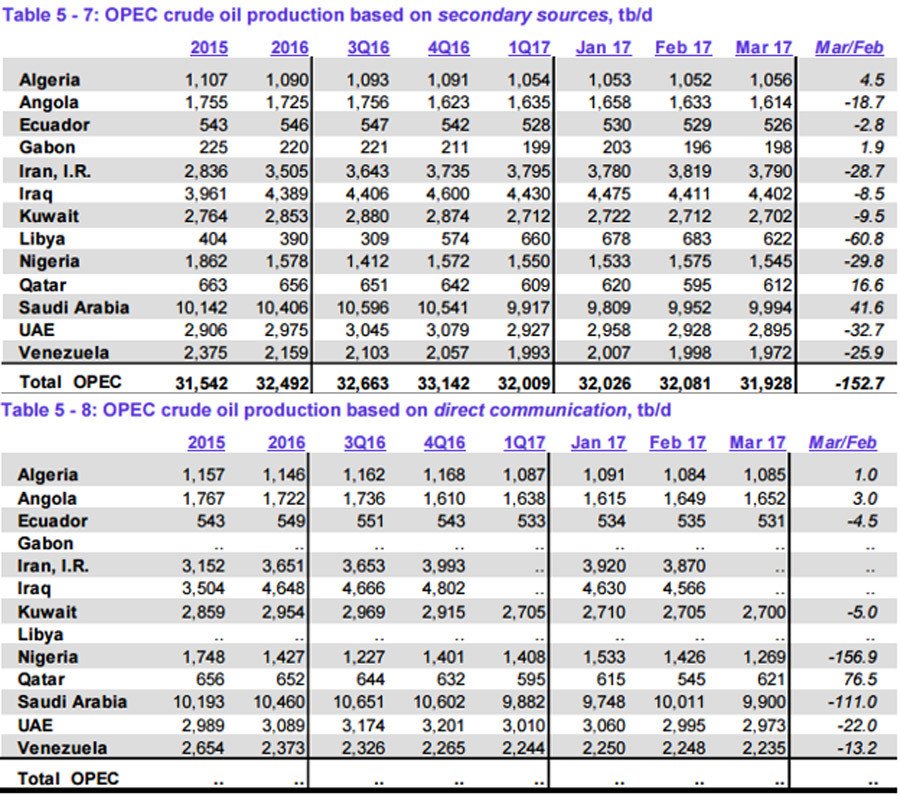
There is always a considerable difference between what the OPEC nations say they are producing and what the “Secondary Sources” say they are producing. The March MOMR had Saudi producing 9,797,000 bpd in February while Saudi said they were producing 10,011,000 bpd. The April MOMR has revised Saudi’s February production up by 155,000 bpd.
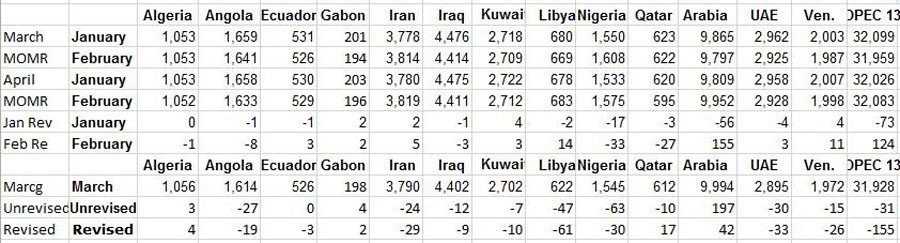
This is a snip from one of my Excel spreadsheets. It shows revisions made in the previous two months’ data by “Secondary Sources”. For instance, Saudi Arabia’s January production numbers were revised down by 56,000 bpd while their February production numbers were revised up by 155,000 bp. OPEC 13 Jan. numbers were revised down by 73,000 bpd while their Feb. numbers were revised up by 124,000 bpd.
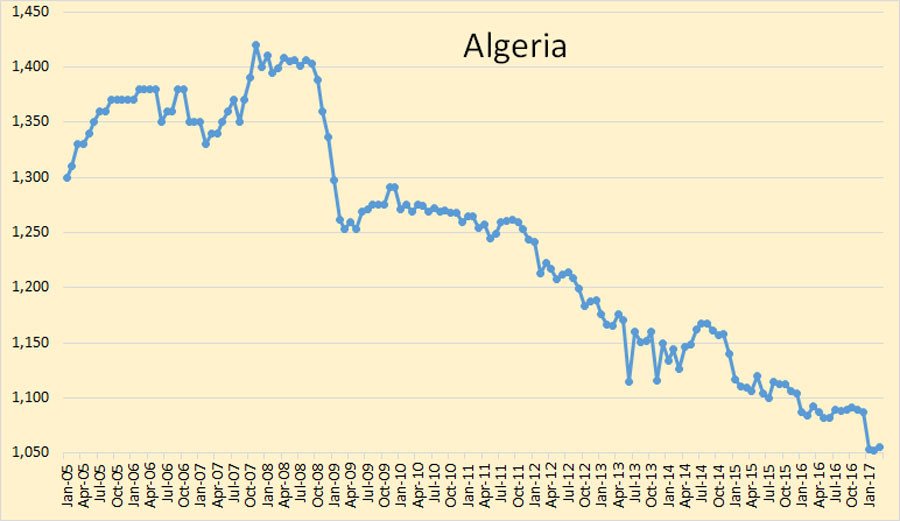
Not much is happening in Algeria. They peaked almost 10 years ago and have been in slow decline ever since.
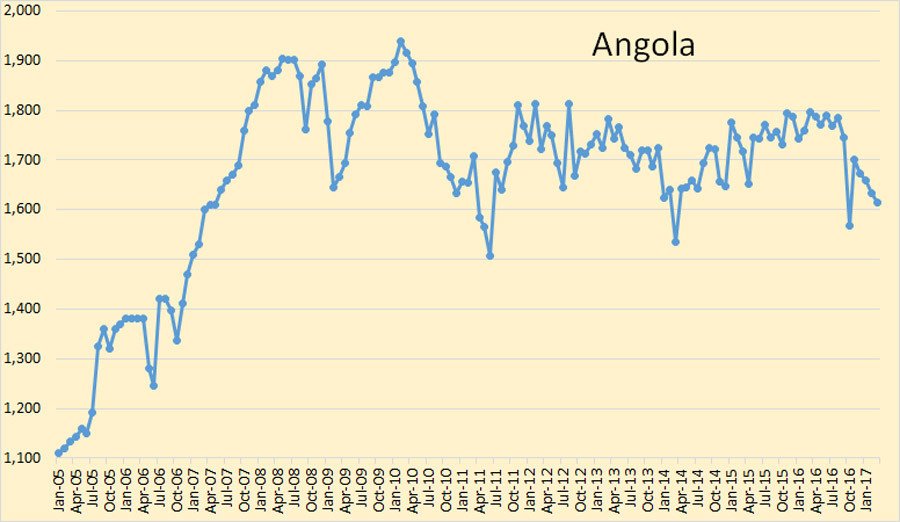
Angola peaked in 2010 but have been holding pretty steady since.
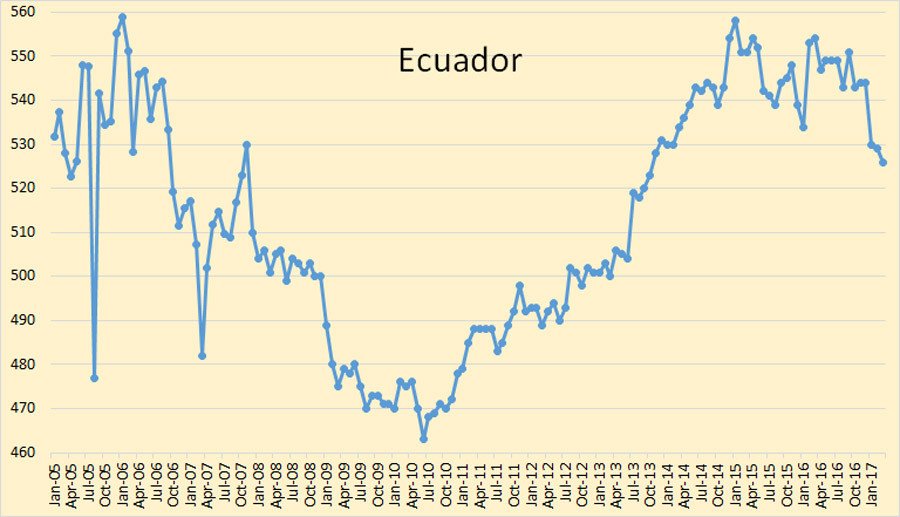
Ecuador peaked in 2015. They will be in a slow decline from now on.
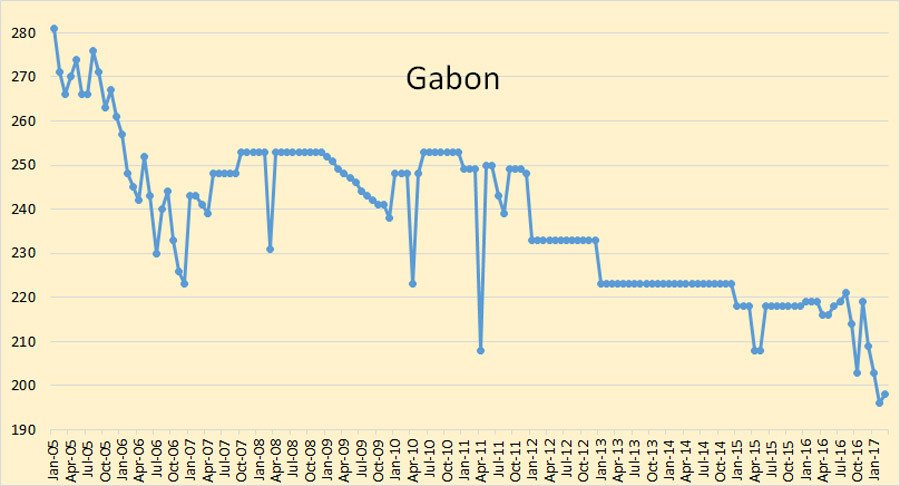
Any change in Gabon crude oil production is too small to make much difference.
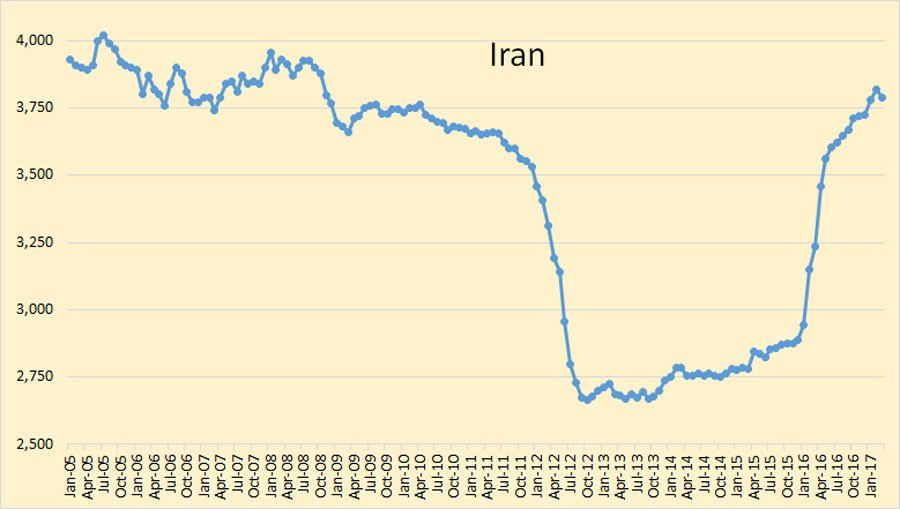
Iran has increased production the last three months, though down slightly in March. However, one source says it is a fallacy.
We believe Iranian destocking is being misinterpreted as production, and actual production will decline as the year moves forward.
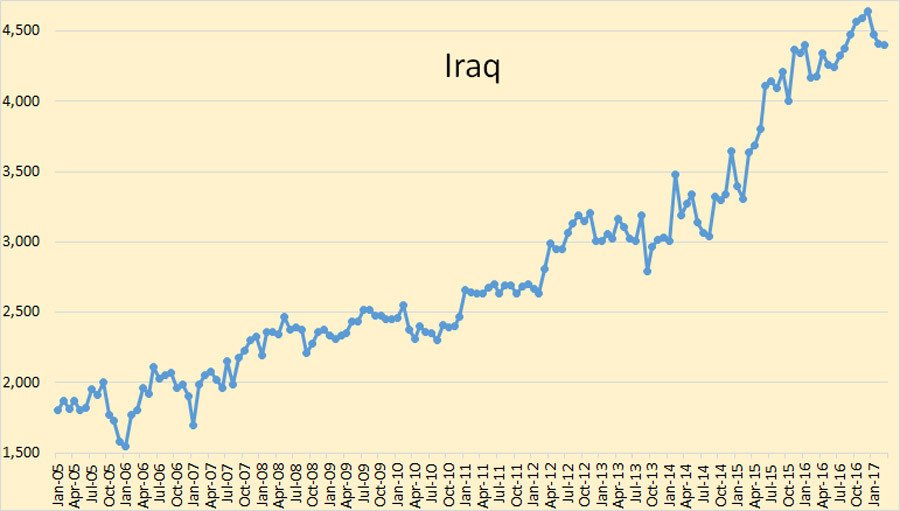
Iraq is down 73,000 bpd from their December peak.
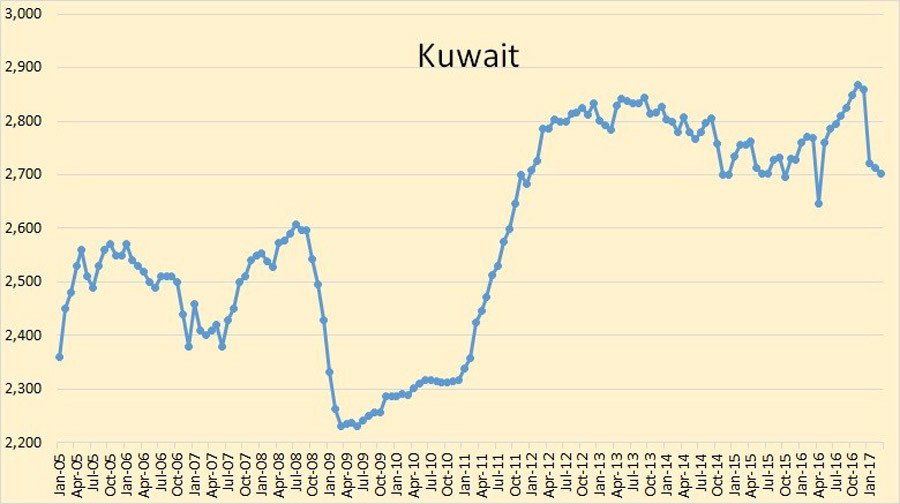
Kuwait is down 166,000 bpd from their November peak. That is about 5.8 percent.
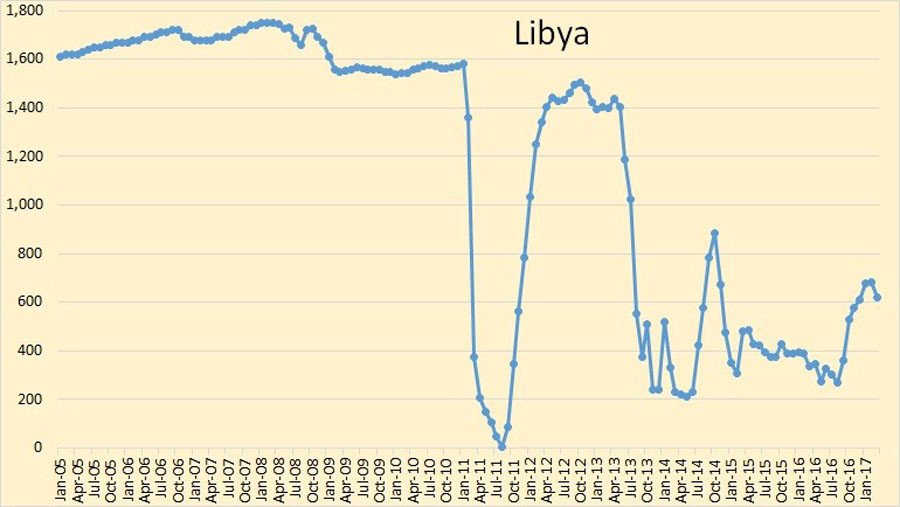
Libya still has problems, and will likely continue to have problems.
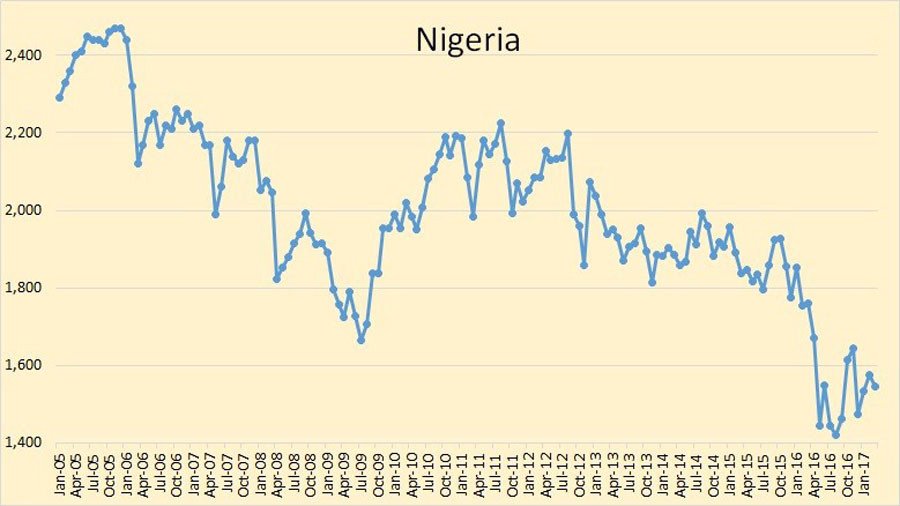
Nigeria and Libya are exempt from quota cuts because of rebel problems. Don’t look for those problems to clear up any way soon.
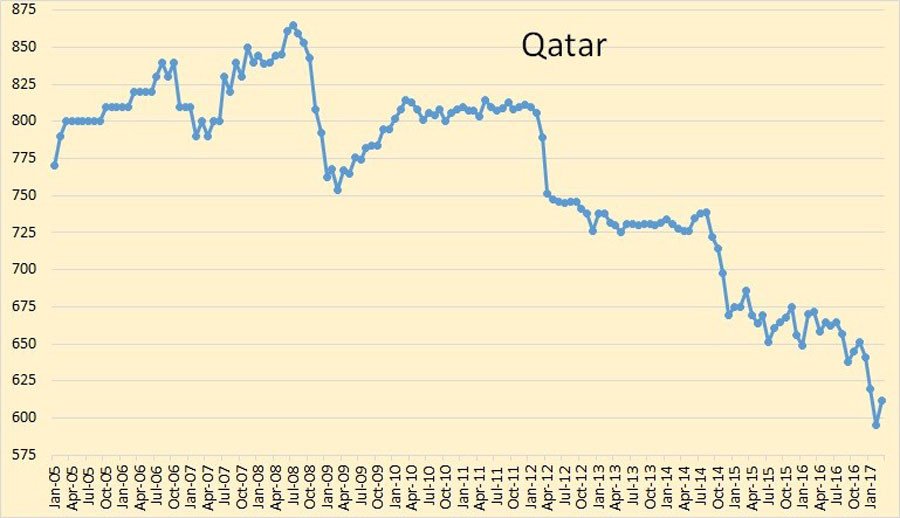
Qatar has been in decline since 2008. Her decline will continue albeit at a very slow pace.
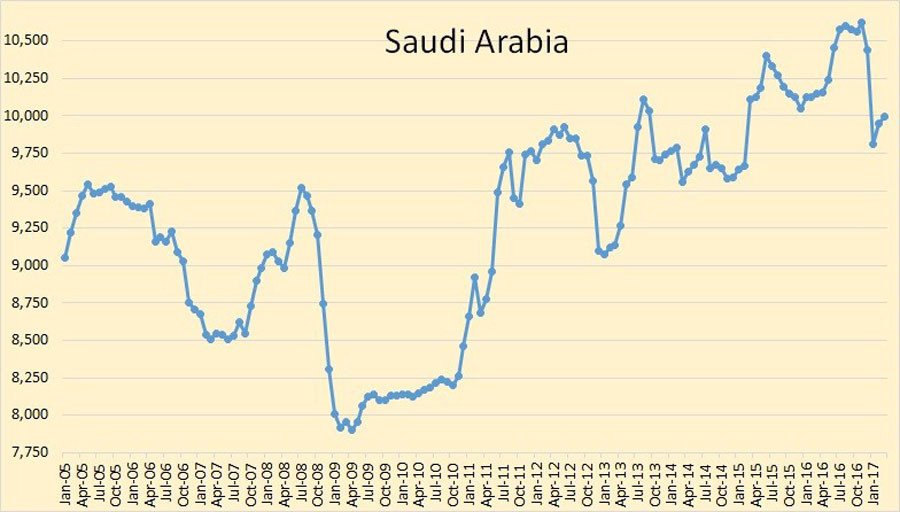
Saudi Arabia cut in January, then stopped cutting. I think this is where we will be for some time unless there is a real shake up in OPEC
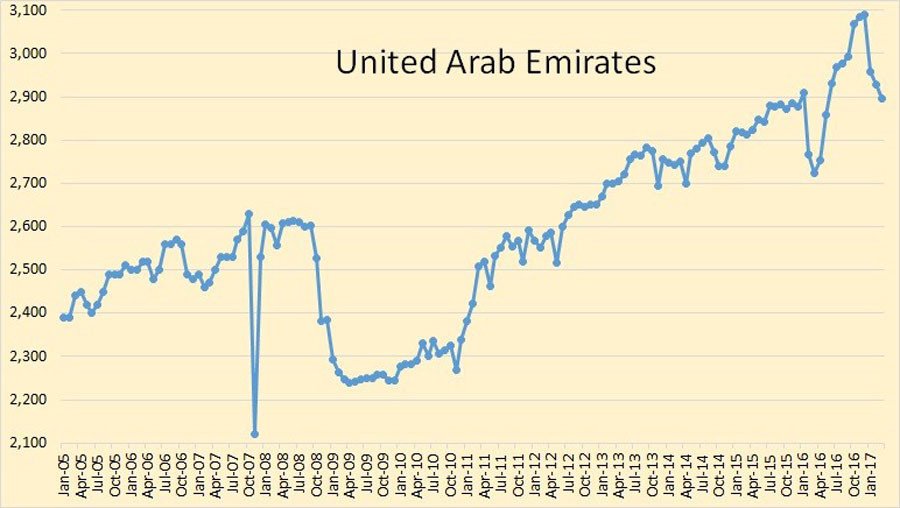
The UAE is down almost 200,000 bpd since December. This is the largest percentage cut in OPEC. I don’t think it is all voluntary.
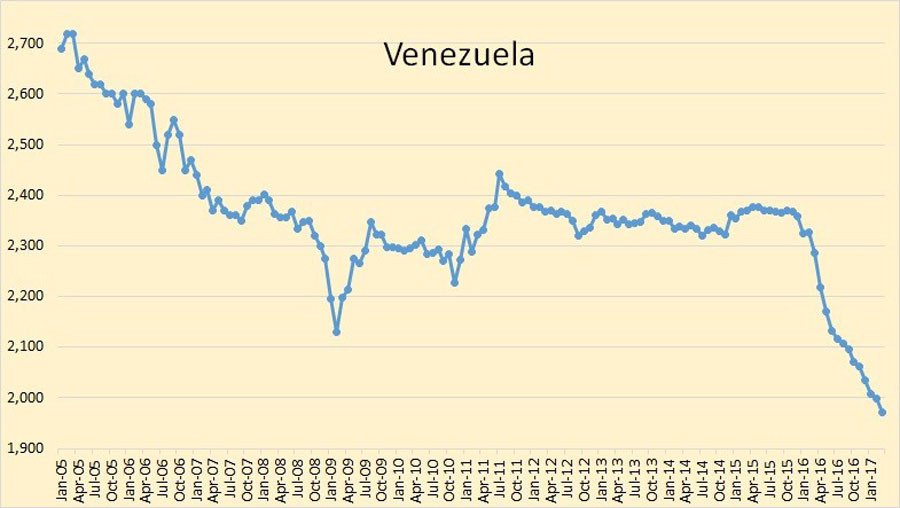
Venezuela’s problems will continue. They are now below two million barrels per day. They are at 1,972,000 bpd. Last March their production was 2,286,000 bpd. They have dropped 314,000 bpd in 12 months. That’s 13.7 percent in one year.
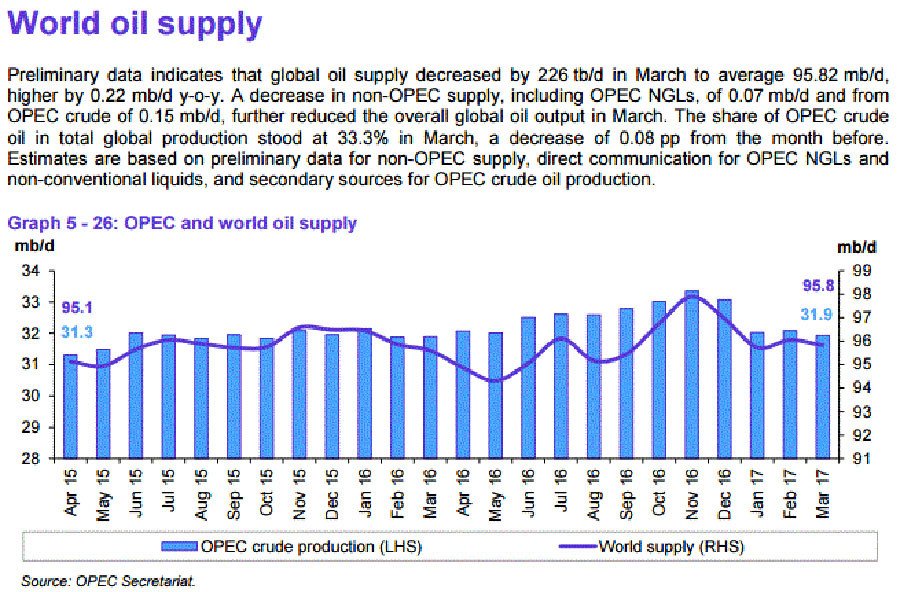
Eyeballing the chart, it looks like World oil production, total liquids, is down about two million barrels per day since peaking in November 2016. OPEC crude production is down 1.45 million barrels per day since November so Non-OPEC liquids, plus OPEC NGLs, would be down just over half a million bpd since then.
This article was originally published on Oilprice.com