US oil dominance is coming to an end

A steep drop in the US tight oil rig count, falling conventional production and sluggish oil demand will crush the US energy dominance agenda.
US energy dominance is over. Output is probably going to drop by 50 percent over the next year and nothing can be done about it. It has nothing to do with the lack of shale profitability or other silly memes cited by people who don’t understand energy.
It’s because of low rig count.
The US tight oil or shale rig count has fallen 69 percent this year from 539 in mid-March to 165 last week. Tight oil production will decline 50 percent by this time next year. As a result, US oil production will fall from to less than 8 mmb/d by mid-2021.
What if rig count increases between now and then? It won’t make any difference because of the lag between contracting a drilling rig and first production.
The party is over for shale and US energy dominance.
Energy Dominance is Over
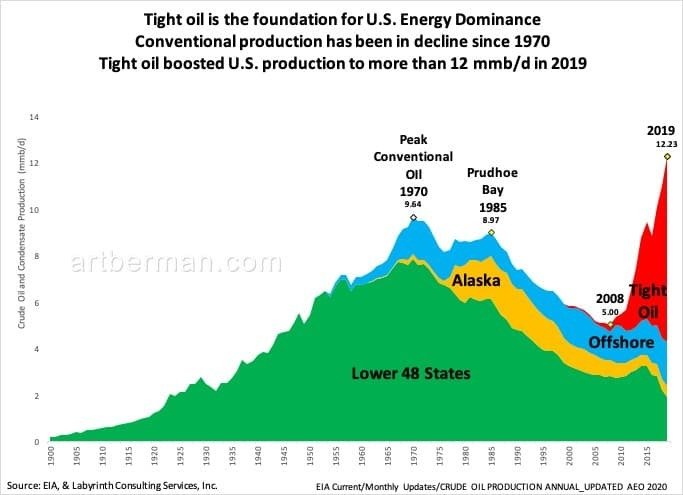
Tight oil is the foundation of US energy dominance. The US has always been a major oil producer but it moved into the top tier of oil super powers as tight oil boosted output from about 5 to more than 12 mmb/d between 2008 and 2019 (Figure 1).
Conventional production has been declining since 1970. It fell from almost 10 mmb/d in 1970 to 5 mmb/d in 2008. Tight oil boosted US production to more than 12 mmb/d in 2019.
Figure 1. Tight oil is the foundation for US Energy Dominance
Tight Oil Rig Count and Oil Production
Rig count is a good way to predict future oil production as long as the proper leads and lags are incorporated.
It takes several months between an upward price signal and a signed contract for a drilling rig. It takes another 9-12 months from starting a well to first production for tight oil wells. With pad drilling, usually all wells on the pad must be drilled before bringing in a crew to frack the wells.
Tight oil horizontal production reached 7.28 mmb/d in November 2019 when the lagged rig count was 613 (Figure 2). That corresponded to 12.9 mmb/d of US oil production—tight oil is about 55 percent of total output. Approximately 600 rigs are needed to maintain 7 mmb/d of tight oil and 12.5 mmb/d of US production.
The horizontal rig count is now 165 so it is unavoidable that production will fall. The considerable lags and leads mean that production decline cannot be expected to reverse until well into 2021 assuming that it starts to increase immediately. That won’t happen because of constrained budgets and low oil prices.
Figure 2. 600 tight oil rigs to maintain 7 mmb/d tight oil/12 mmb/d total US output
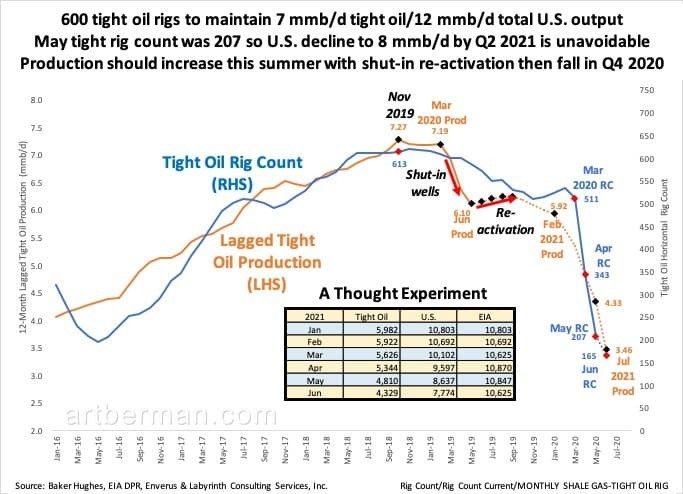
May tight rig count was 207 so US decline to 8 mmb/d by Q2 2021 is unavoidable. Production should increase this summer with shut-in re-activation then fall in Q4 2020.
US producers shut in most of their wells in May because oil prices had collapsed and storage had reached its limits. Tight oil production has fallen more than 1 mmb/d to 6.2 mmb/d and total US output is around 10.5 mmb/d.
With the storage crisis now apparently averted and with somewhat higher oil prices, most tight oil wells are being re-activated. Production should increase until all shut-in wells are back on line and then, it will resume its decline.
Based on rig count analysis, US oil production will probably be about 8 mmb/d by mid-2021 or more than 4 mmb/d less than peak November 2019 levels.
Killer Decline RatesRequire Lots of Rigs
Lower US crude and condensate production is unavoidable with rig counts where they are today. That is because tight oil decline rates are really high.
Figure 3 shows Permian basin shale play decline rates by year of first production. The average of all years is 27 percent per year. More recently drilled wells decline at higher rates because of better drilling and completion technology. The problem is that the wells don’t have greater reserves—they just produce the reserves faster. That means higher decline rates.
Figure 3. Permian basin annual decline rate is 27 percent for horizontal tight oil wells
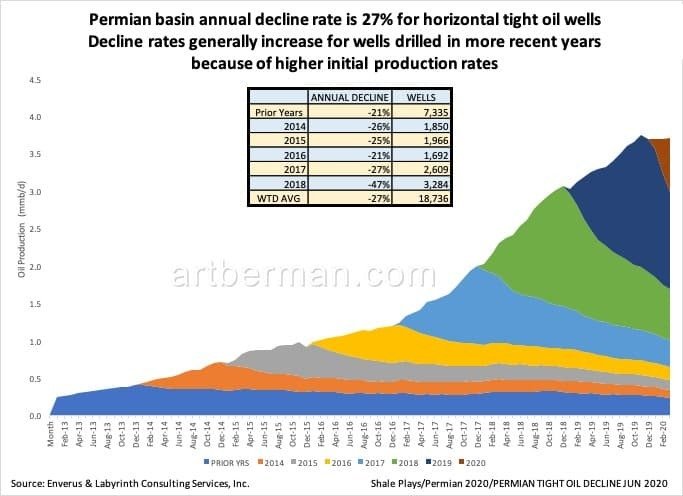
Decline rates generally increase for wells drilled in more recent years because of higher initial production rates.
This is not a criticism of the plays or the companies. It’s just a fact.
And that’s why it’s critical to keep 500 or 600 rigs drilling all the time—to replace the 30 percent of output lost every year to depletion.
Production can be turned off and on as it was in May and June. Production cannot be increased without adding rigs and drilling new wells. Assuming there was infinite capital available to add rigs and drill wells, it would take several years to increase rig count to levels needed to maintain 2019 output levels.
Drilled, uncompleted wells (DUC) may be brought on to slow the rate of production decline somewhat. It is important to note, however, that completion accounts for at least 50 percent of total well cost. Capital constraints and low oil prices will affect the ability and enthusiasm of companies to complete DUCs.
After the last oil-price collapse, it took 2.5 years for tight oil rig count to increase from 193 in May 2016 to 618 in November 2018 (Figure 3). There were thousands of DUCs during the last oil-price collapse in 2014-2017 but they didn’t have much effect on production decline.
The current June rig count of 165 will continue to fall for several months because of low oil price & capital budgets.
Figure 4. It took 2.5 years for tight oil rig count to increase from 193 in May 2016 to 618 in November 2018
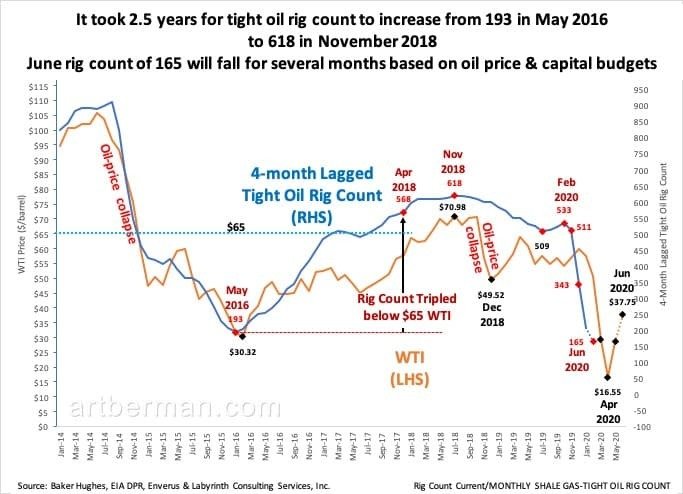
June rig count of 165 will fall for several months based on oil price & capital budgets.
Rigs Don’t Produce Oil, Wells Do
I’ve shown how rig count, lagged production and decline rates are used to estimate future levels of production. That approach is useful but the truth is that rigs don’t produce oil—wells do.
Another approach, therefore, is to compare the number of tight oil wells that were drilled and completed during each of the last 5 years to the corresponding average production rates for each of those years. Then, using year-to-date drilling and completion data, we can annualize and project what 2020 production is likely to be.
This approach suggests that 2020 tight oil production will be about 30 percent less than in 2019 (Figure 4). Since tight oil represented 56 percent of total US output in 2019, we may then estimate that US production will average about 8.7 mmb/d in 2020.
Figure 5. 2020 US production will be less than ~8.7 mmb/d vs 12.3 mmb/d in 2019
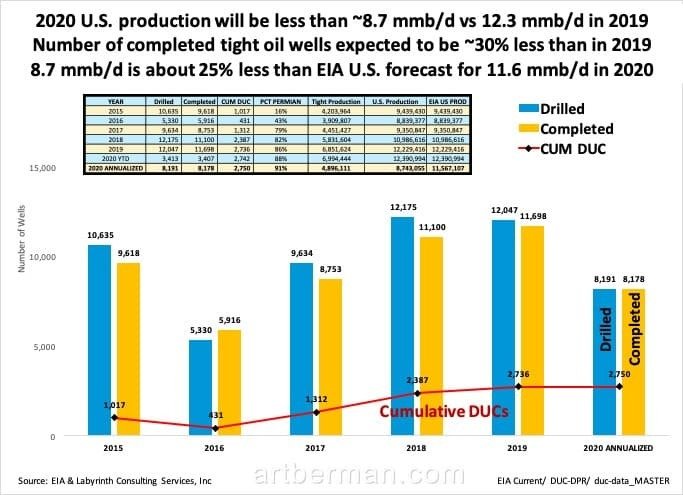
Number of completed tight oil wells expected to be ~30 percent less than in 2019. 8.7 mmb/d is about 25 percent less than EIA US forecast for 11.6 mmb/d in 2020.
That is similar to the estimate obtained from the rig count approach. It is, however, about 25 percent less than EIA’s 2020 forecast for US crude & condensate production.
Energy Dominanceand Green Paint
Much lower US oil production is bad for Trump’s Energy Dominance anthem and its corollary that the US is energy independent. It’s even worse for oil prices and the US balance of payments once demand recovers. We will have to import even more oil than we do today and it will cost more.
The idea of US energy independence is ignorant at best and fraudulent at worst. The US imported nearly 7 mmb/d of crude oil and condensate in 2019 and more than 9 mmb/d of crude oil and refined products. That’s almost as much as China—the world’s second largest economy—consumes.
The US is a net exporter in the same way that shale companies are making huge profits—by accounting sleight-of-hand.
The US imports other people’s crude oil, refines it and then, exports it. If a country imports unpainted cars, paints them green and then exports them, is it a net exporter of cars? No. It’s an exporter of green paint.
The US is screwed when it comes to near- to medium-term oil production. It’s not because of Covid-19. US rig count began to decline 15 months before anyone had heard of Covid-19. Even if the road to economic and oil-demand recovery is faster than I believe it will be, it will take a long time to get back to 12 or 13 million barrels per day of production.
There are good reasons to expect that much lower US oil production will eventually lead to higher oil prices. That may result in renewed drilling and another cycle of over-supply and lower oil prices. That is how things have developed in the past.
But a new phase of economic reality and oil pricing is unfolding and no one knows where it will lead. Lower demand may mean that reduced US oil output is appropriate. The only thing that seems certain is that the US will not be the oil super power it was before 2020.
By Arthur Berman for Oilprice.com