This is how global trade looks before economic wars kick in (INFOGRAPHICS)
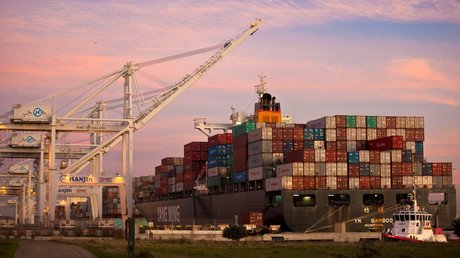
Global commerce is descending into the era of trade wars and protectionism. Here is how the global trade environment looks after decades of falling barriers – which are now being set up again.
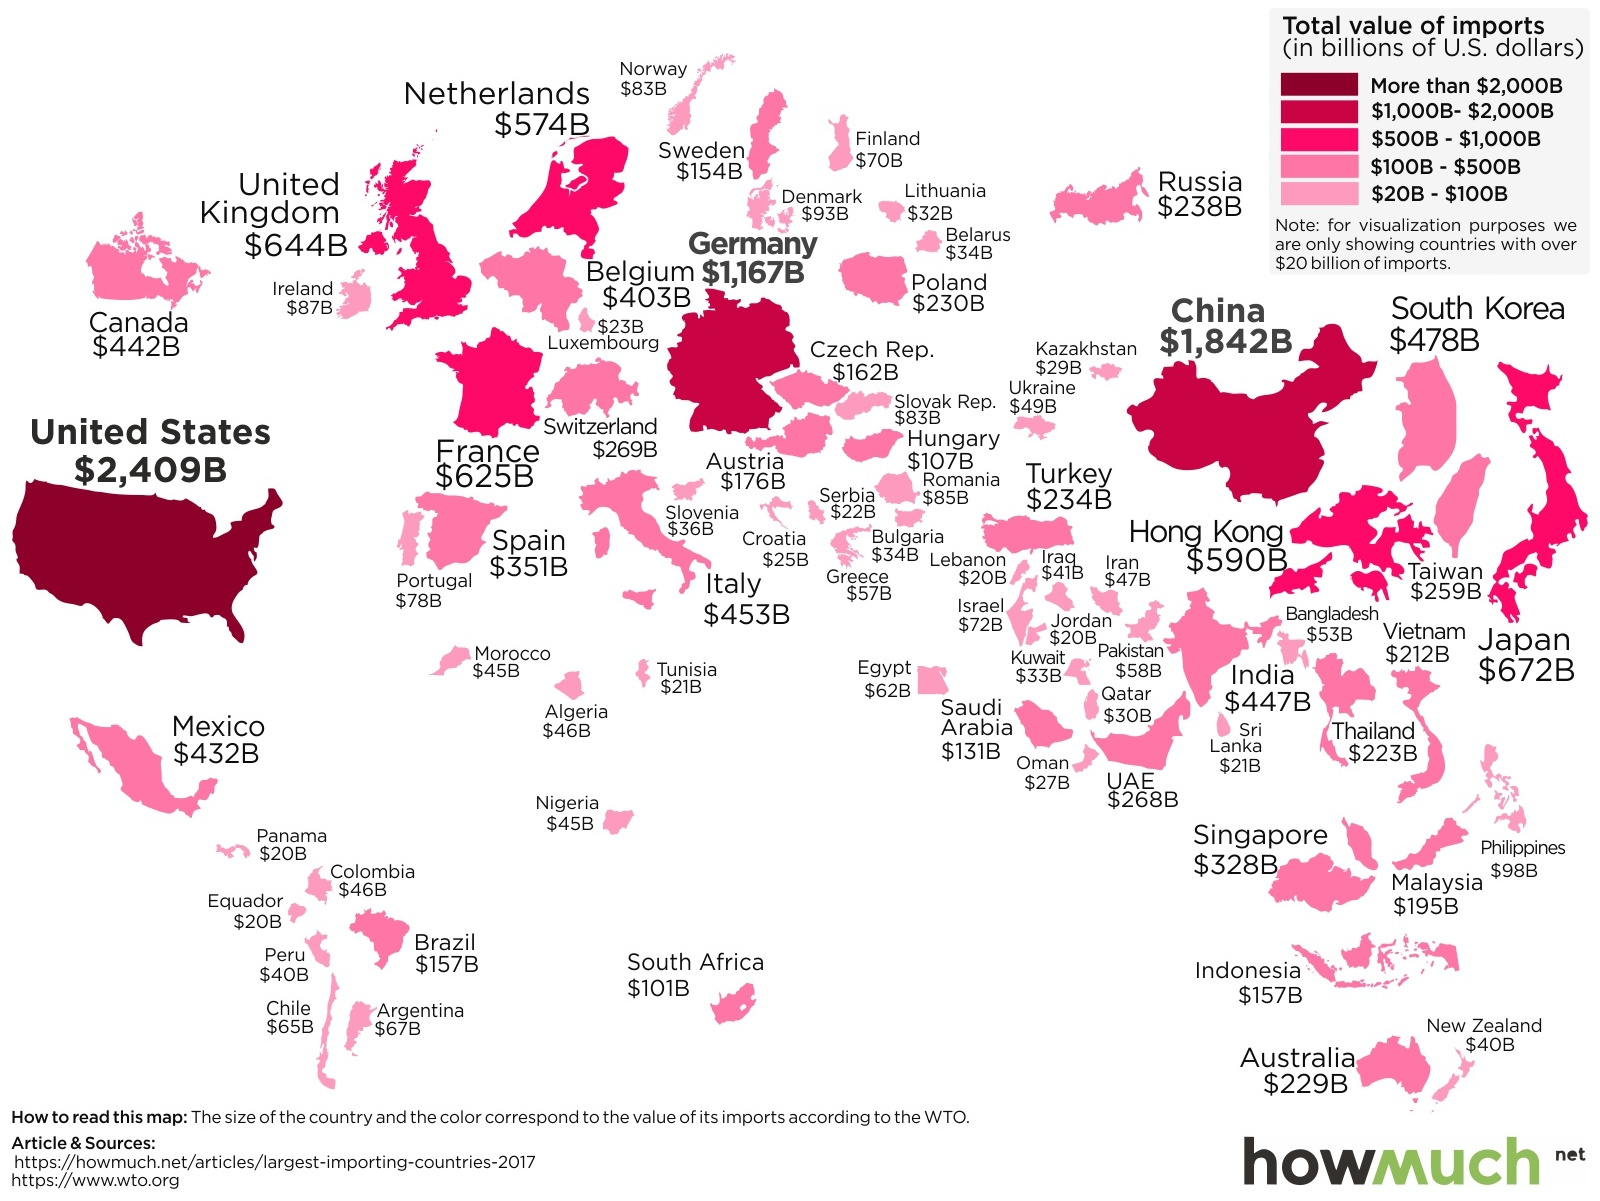
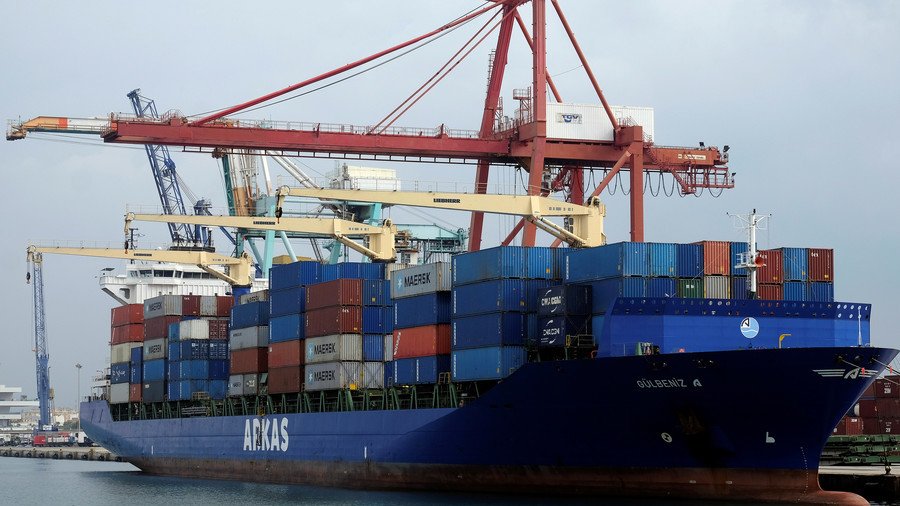
The United States is the leader in imports, buying $2,409 billion worth of goods in 2017, about 13.4 percent of the global total, according to the data quoted by Visual Capitalist. This is $860 billion higher than the country’s sales abroad last year.
This deficit has resulted in US President Donald Trump’s tariffs and barriers and the reciprocal action which has triggered trade wars.
China and Germany come in at No.2 and No.3 respectively. China buys $1,842 billion worth of goods – 10.2 percent of the global total – while Germany, Europe’s largest economy, imports $1,167 billion (6.5 percent of total) of goods.
For more stories on economy & finance visit RT's business section